2025 Foreclosure Trends: U.S. Map Shows Percentage of Homes Filed by State


Foreclosure headlines are making noise again – and they’re designed to stir up fear to get you to read them. But what the data shows is actually happening in the market tells a very different story than what you might be led to believe. So, before you jump to conclusions, it’s important to look at the full picture.
Why Foreclosure Headlines Don’t Tell the Full Story
Yes, foreclosure starts are up 7% in the first six months of the year. But zooming out shows that’s nowhere near crisis levels. Here’s why.
Foreclosure Filings Are Still Far Below Historic Highs
Even with the recent uptick, overall foreclosure filings are still very low. In the first half of 2025, just 0.13% of homes had filed for foreclosure. That’s less than 1% of homes in this country. In fact, it’s even far less than that at under a quarter of a percent. That’s a very small fraction of all the homes out there. But like with anything else in real estate, the numbers vary by market.
State-by-State Foreclosure Rates in 2025
Here’s the map you need to see that shows how foreclosure rates are lower than you might think, and how they differ by local area:
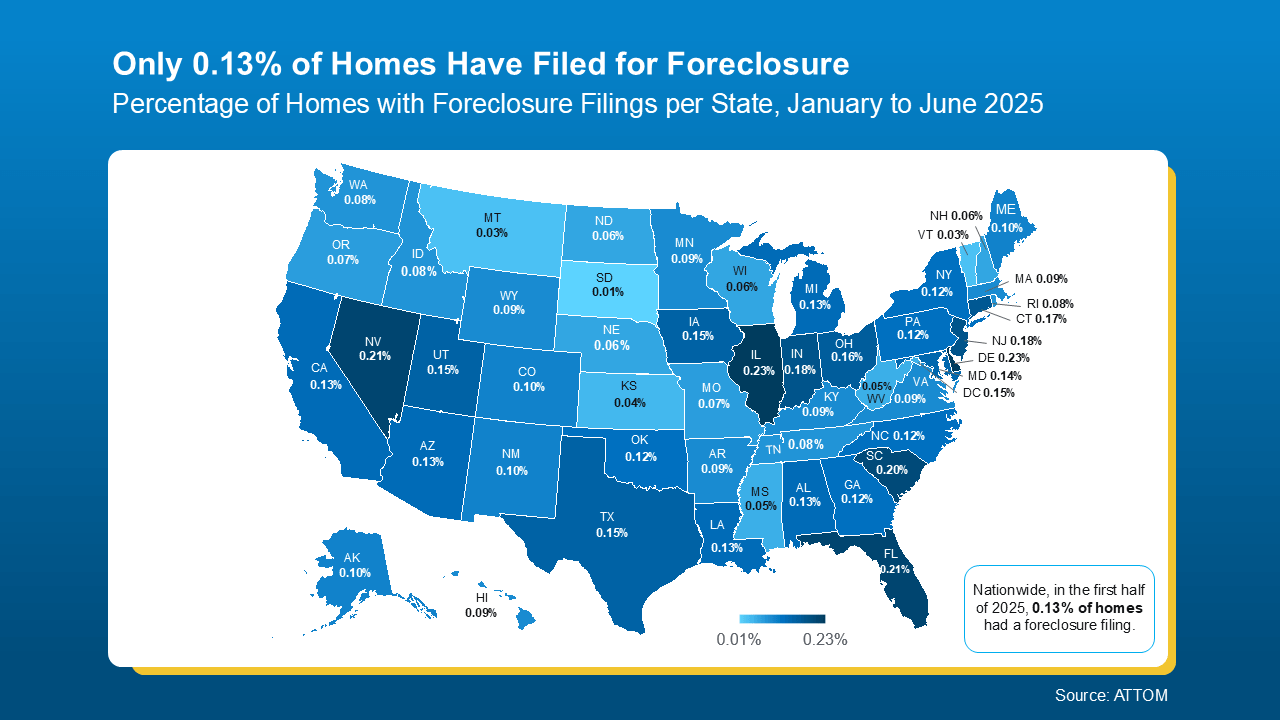
For context, data from ATTOM shows in the first half of 2025, 1 in every 758 homes nationwide had a foreclosure filing. Thats the 0.13% you can see in the map above. But in 2010, back during the crash? Mortgage News Daily says it was 1 in every 45 homes.
Today’s Numbers Don’t Indicate a Market in Trouble
But here’s what everyone remembers…
Leading up to the crash, risky lending practices left homeowners with payments they eventually couldn’t afford. That led to a situation where many homeowners were underwater on their mortgages. When they couldn’t make their payments, they had no choice but to walk away. Foreclosures surged, and the market ultimately crashed.
Today’s housing market is very different. Lending standards are stronger. Homeowners have near record levels of equity. And when someone hits financial trouble, that equity means many people can sell their home rather than face foreclosure. As Rick Sharga, Founder of CJ Patrick Company, explains:
“. . . a significant factor contributing to today’s comparatively low levels of foreclosure activity is that homeowners—including those in foreclosure—possess an unprecedented amount of home equity.”
What Homeowners Can Do if Facing Financial Hardship
No one wants to see a homeowner struggle. But if you’re a homeowner facing hardship, talk to your mortgage provider. You may have more options than you think.
Bottom Line: Don’t Let Fear Drive Your Real Estate Decisions
Recent headlines may not tell the whole story — but the data does. Foreclosure activity remains low by historical standards and is not a sign of another crash.
If you're in San Diego County — including areas like Vista, Oceanside, Escondido, Fallbrook, Bonsall, San Marcos, Carlsbad, or Valley Center — and you're watching the market or wondering how this impacts your own situation, I’m here to help.
✅ Curious about your home’s value?
✅ Want a quick market snapshot for your neighborhood?
✅ Thinking about buying a home?
✅ Ready to start selling your home? Contact us to get started with a personalized strategy.
Let’s connect! I’ll help you separate fear from facts so you can move forward with clarity.
Categories
- All Blogs (126)
- Buyer & Seller Resources (18)
- Buyers (3)
- First-Time Buyers (24)
- Foreclosure Trends (2)
- Foreclosure Updates (2)
- Home Buying Tips (46)
- Home Improvement (1)
- Home Selling Tips (37)
- Homebuyer Tips (25)
- Homeowner Tips (16)
- Housing Market Insights (23)
- Housing Market Trends (38)
- Market Updates (16)
- Mortgage Education (11)
- Mortgage Insights (11)
- New Construction (3)
- Pricing Strategy (2)
- Real Estate Advice for Buyers (21)
- Real Estate Advice for Sellers (23)
- Real Estate Insights (20)
- Real Estate Market Updates (30)
- Renting vs. Owning (4)
- Retirement Planning (1)
- Seller Resources (13)
- Sellers (10)
- VA Home Loans (1)
Recent Posts